Quick Summary
A top paint company in India offering a wide range of decorative and industrial paint products, required solutions to enable senior management to make informed business decisions in one single view. CRG Solutions created a platform for real-time data and automated analysis that reduced manual intervention to analyze data daily, covering multiple segments along with KPIs.

About the Customer
One of the leading paint companies in India, offers a wide range of decorative and industrial paint products. With manufacturing units and sales offices across the country, the company is committed to delivering high-quality paints for various applications. The company provides trained painters, on-site support, product delivery, color tools, resources, and a “World of Colors” for inspiration and insight. By integrating data, the company can gain actionable insights, improve operational efficiency, and stay responsive to market dynamics, positioning the company for sustained growth and success.

Problem Statement
Some of the challenges faced were in integrating data from various sources across departments. The challenges included inaccurate, incomplete, or inconsistent data leading to misleading insights and hindering effective decision-making by senior management. Data consolidation, handling increasing data volumes, and ensuring scalability for long-term effectiveness required meticulous effort. Data integration, data quality issues, user adoption, and scalability were broadly all big pillars that required a 360-degree overhaul.

Solution
Given the challenges, implementing data visualization solutions wasn’t without hurdles. Integrating data from various departments required meticulous effort to ensure accuracy and consistency. Data quality itself was a challenge, as inaccurate information could lead to misleading insights. Encouraging user adoption also proved critical, with training and support needed to overcome resistance to change. Finally, designing dashboards that could scale with increasing data volumes and future needs was essential for long-term success. The project followed an agile methodology, encompassing the following steps:

Top-to-Bottom Approach: The implementation began with an overall country-level view and progressively drilled down to the dealer network, incorporating sales hierarchy, product hierarchy, and geographical hierarchy..
KPI Definition: The KPIs were defined in collaboration with the business team, considering factors such as time analysis, dealer network expansion, and ad hoc analysis.


KPI Definition: The KPIs were defined in collaboration with the business team, considering factors such as time analysis, dealer network expansion, and ad hoc analysis.

Dashboard Development: Customized dashboards were created for the Sales and Marketing, Manufacturing, and Finance departments. These dashboards included KPIs such as manufacturing productivity, sales analysis, outstanding payments, finance metrics, and more.
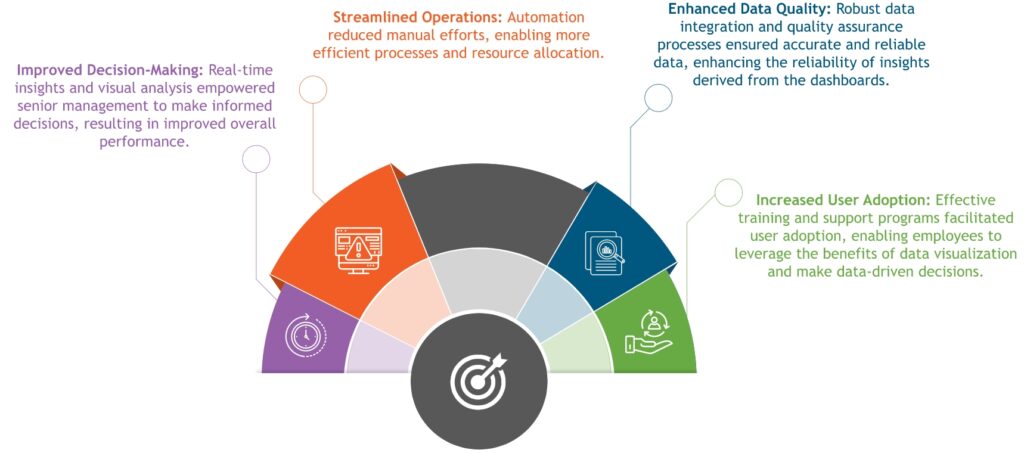
The implementation of data visualization solutions yielded significant results, including real-time insights for informed decision-making, proactive issue identification, improved operational efficiency, enhanced data accuracy, increased collaboration and accountability, improved customer experience, cost savings, scalability for future growth, and a data-driven decision-making culture. These outcomes have positioned the Company for sustainable growth and continued success in the paint industry.

Business Benefits


Leave a Comments
You must be logged in to post a comment.