
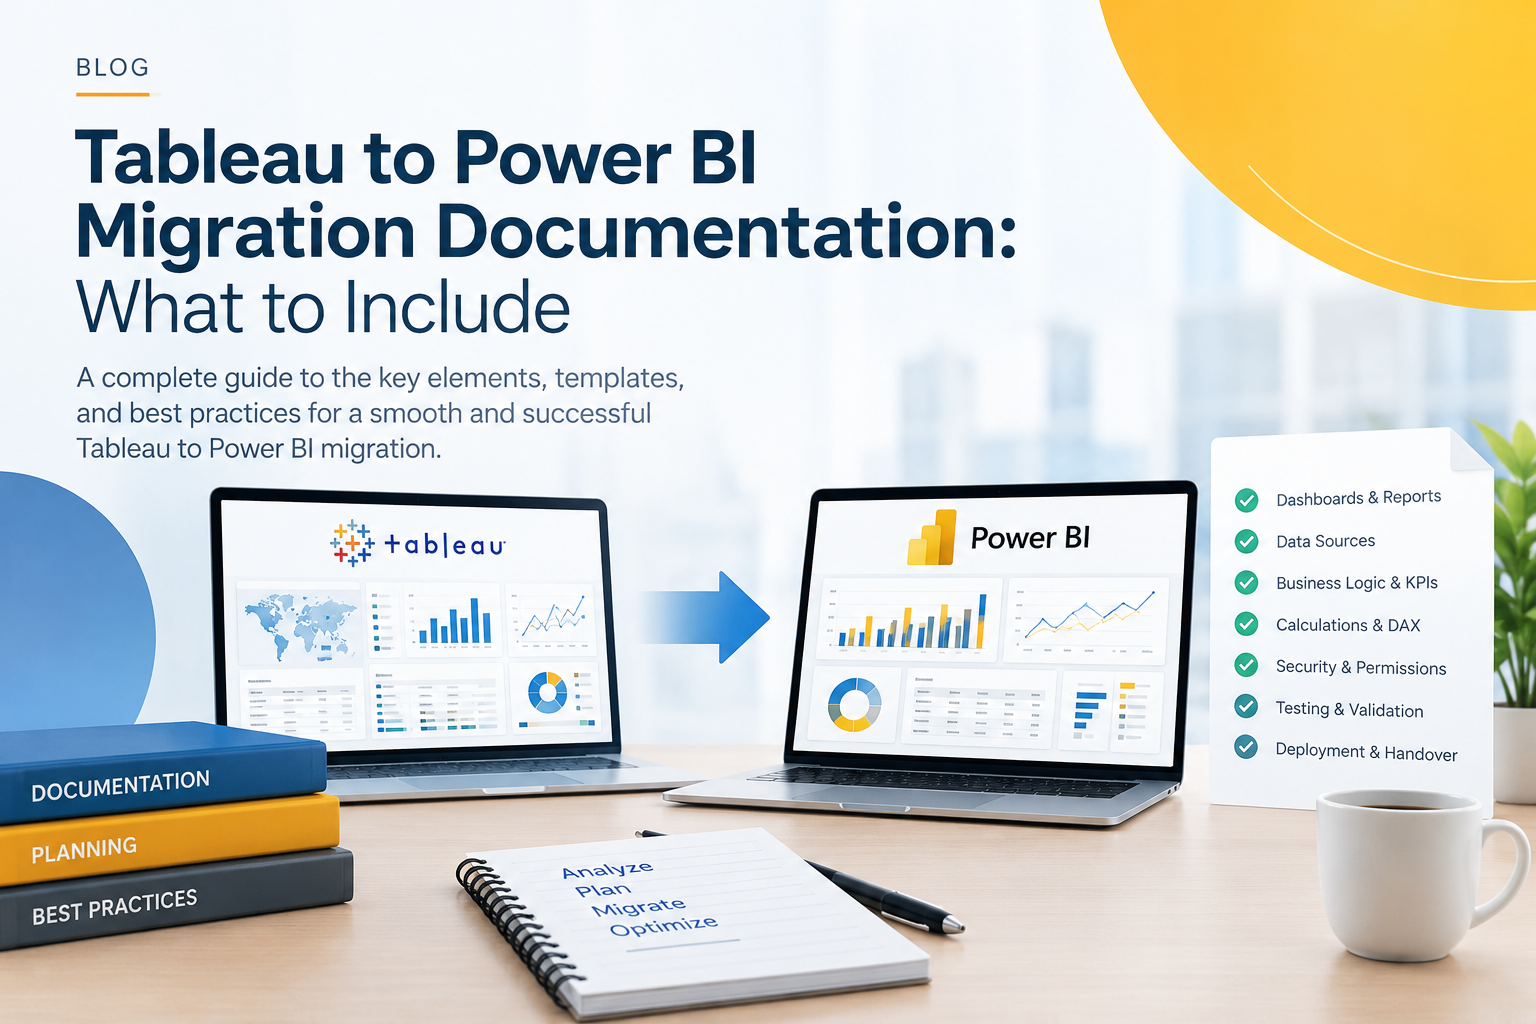
A successful Tableau to Power BI migration involves more than rebuilding dashboards in a different business intelligence platform. Organizations must also understand how existing reports work, where their data comes from, how business calculations are defined, and how users interact with the reporting environment.
This is where migration documentation becomes essential.
Tableau to Power BI migration documentation is a structured record of the existing Tableau environment, the decisions made during migration, the corresponding Power BI implementation, and the testing required to confirm that the new reporting environment meets business requirements.
It can include dashboard inventories, data-source mappings, calculation definitions, DAX logic, security configurations, testing results, deployment procedures, and known limitations.
Without this documentation, organizations risk losing important business knowledge, overlooking dependencies, duplicating development effort, or introducing inconsistencies into business-critical reports.
The objective is to create a reliable reference that helps technical teams migrate accurately and enables business users to understand, validate, and maintain the new Power BI environment.
2. Building a Shared Understanding of the Migration
A successful Tableau to Power BI migration involves more than moving dashboards between platforms. It requires coordination between technical teams, business stakeholders, and project leaders to ensure that existing reports, calculations, data sources, and business requirements are accurately carried forward.
IT leaders and CIOs need visibility into migration priorities, technology decisions, and governance. Business intelligence managers and Tableau administrators contribute their understanding of existing workbooks, reporting standards, and dashboard dependencies. Power BI developers and data engineers focus on rebuilding reports, translating calculations into DAX, designing data models, and validating data accuracy.
Project managers help coordinate timelines, risks, responsibilities, and approvals, while business stakeholders and report owners confirm that the migrated dashboards continue to meet operational needs and support informed decision-making.
Bringing these perspectives together helps organizations identify dependencies early, reduce misunderstandings, and maintain consistency throughout the migration. Even when only a limited number of dashboards are involved, documenting key decisions and technical details makes future updates, troubleshooting, and maintenance easier.
3. How CRG Solutions Helps With Tableau to Power BI Migration — and Why Choose CRG Solutions?
A well-documented migration requires an understanding of both the technical environment and the business processes supported by reporting.
CRG Solutions works across business performance improvement, data analytics, business intelligence, and technology enablement. Its analytics capabilities include Tableau and Alteryx, helping organizations turn data into actionable insights and improve the way information is managed and used.
For a Tableau to Power BI migration, a structured approach can help organizations assess their current reporting environment, understand migration dependencies, plan dashboard redevelopment, and validate the resulting Power BI implementation.
Key areas of focus include:
Migration assessment and planning: Establishing the scope of the existing Tableau environment, identifying important reporting assets, and organizing the migration into manageable stages.
Dashboard and dependency analysis: Understanding how workbooks, calculations, data sources, and business-critical reports relate to one another.
Business logic preservation: Documenting KPI definitions and calculation requirements so that important business rules remain clear throughout the transition.
Power BI implementation and validation: Supporting the development and review of reports, calculations, data models, and reporting functionality against documented requirements.
Governance and long-term maintainability: Creating documentation that can support future enhancements, troubleshooting, onboarding, and reporting consistency.
Why choose CRG Solutions?
Organizations need a migration approach that considers more than the technical conversion of dashboards. The reporting environment must continue to support business decisions, provide trustworthy information, and remain maintainable after implementation.
CRG Solutions brings experience in business intelligence, analytics, and business performance improvement. This broader perspective can help enterprises approach migration as an opportunity to improve reporting architecture and standardize analytics practices, rather than simply reproduce the existing environment.
The goal is to establish a Power BI environment supported by clear documentation, validated business logic, and a practical foundation for future growth.
4. Why Is Documentation Important During Tableau to Power BI Migration?
Migration documentation is often treated as an administrative task. In reality, it is an important part of migration planning, development, testing, and ongoing governance.
Preserve business knowledge
Tableau dashboards may contain calculations developed over several years. Some may rely on undocumented business rules or decisions understood by only a few employees.
Documenting these rules helps preserve institutional knowledge when team members change or the original developers are no longer available.
Reduce calculation errors
A dashboard can look correct while producing inaccurate results.
Documenting KPI definitions, calculation logic, filters, and aggregation rules helps developers reproduce the intended business outcomes and gives testers a clear reference for validation.
Identify dependencies early
A single data source or calculation may support multiple dashboards. Recording these relationships helps teams understand the potential impact of changes before development begins.
Improve collaboration
Developers, data engineers, project managers, and business users often work on different parts of a migration. Shared documentation gives them a common reference for requirements, decisions, and progress.
Simplify future maintenance
After migration, teams may need to modify a report, troubleshoot a discrepancy, or introduce a new KPI. Clear documentation makes these activities easier and reduces dependence on individual developers.
Organizations managing complex reporting environments need clear documentation to maintain consistency, reduce migration risks, and validate business-critical reports. For companies planning Tableau to Power BI Migration in New York, documenting dashboard dependencies, data mappings, calculations, and validation procedures can help teams coordinate the transition and maintain reliable reporting.
5. What Should Tableau to Power BI Migration Documentation Include?
The following components form the core of a practical migration documentation framework.
A well-maintained documentation framework should cover data sources, business logic, dashboard functionality, security requirements, and testing results. For enterprises undertaking Tableau to Power BI Migration in Chicago, this documentation provides technical teams and business stakeholders with a shared reference for rebuilding dashboards and confirming that migrated reports meet business requirements.
5.1 Project Scope and Migration Objectives
Start by documenting why the organization is migrating and what the project is expected to achieve.
This section should include:
- Business reasons for migration.
- Departments and user groups involved.
- Tableau environments included in scope.
- Number and types of dashboards being assessed.
- Target Power BI environment.
- Key project milestones.
- Success criteria.
- Project constraints and assumptions.
- Out-of-scope items.
For example, the project objective may be to migrate finance and sales reporting while improving KPI consistency and consolidating duplicate dashboards.
Clear objectives help teams make better decisions when choosing whether to replicate, redesign, consolidate, or retire existing reports.
5.2 Tableau Dashboard and Workbook Inventory
A dashboard inventory is one of the most important documents to prepare before development begins.
It establishes exactly what exists in Tableau and provides a reference for tracking migration progress.
For each workbook or dashboard, record details such as:
- Workbook and dashboard name.
- Tableau project or folder.
- Business department.
- Report owner.
- Primary users.
- Business purpose.
- Usage frequency, where available.
- Data sources.
- Number of worksheets and dashboards.
- Complexity rating.
- Business criticality.
- Migration priority.
- Assigned Power BI destination.
- Current migration status.
A sample inventory might look like this:
| Tableau Asset | Business Owner | Complexity | Migration Decision | Status |
| Monthly Sales Performance | Sales | Medium | Migrate | In progress |
| Regional Revenue Analysis | Finance | High | Redesign | Assessment |
| Legacy Sales Summary | Sales | Low | Review for consolidation | Pending |
| Quarterly Operations Report | Operations | Medium | Migrate | Not started |
The entries above are illustrative examples.
Why it matters: Without a central inventory, organizations can overlook important reports, migrate duplicates, or lose track of assets during large projects.
5.3 Data Source and Dependency Mapping
A Tableau dashboard may rely on several underlying components, including databases, spreadsheets, extracts, published data sources, and transformation processes.
The documentation should explain where the data comes from and how it reaches each report.
Record:
- Source system and database.
- Tables and views used.
- Data-source connection type.
- Extract or live connection configuration.
- Data transformations.
- Joins and relationships.
- Refresh frequency.
- Data owners.
- Credentials and access requirements, documented securely.
- Downstream dashboards and reports.
- Relevant gateway or integration requirements.
A simple dependency record could look like this:
| Tableau Asset | Source | Dependency | Power BI Consideration |
| Sales Dashboard | Sales database | Revenue and customer tables | Rebuild model and measures |
| Inventory Dashboard | ERP system | Product and stock tables | Validate relationships |
| Finance Dashboard | Data warehouse | Finance views | Review permissions and refresh |
Dependency mapping is particularly important when multiple dashboards share the same data source. It helps teams plan migration order and avoid rebuilding shared components unnecessarily.
5.4 Business Logic and KPI Definitions
Business logic should be documented separately from the technical implementation wherever possible.
A metric such as revenue, profit margin, customer retention, or inventory turnover may have a specific definition approved by the organization.
For each KPI, document:
- KPI name.
- Business definition.
- Calculation or formula.
- Unit of measurement.
- Aggregation method.
- Reporting period.
- Filters and exclusions.
- Relevant business rules.
- Business owner.
- Expected output or reference value.
- Approval status.
For example, two departments may use different definitions of active customers. If the migration team assumes the definitions are identical, the resulting reports could create confusion.
A documented KPI definition helps ensure that Power BI reproduces the approved business meaning rather than merely copying a formula.
5.5 Tableau Calculations and DAX Mapping
Tableau calculations may need to be recreated using DAX measures, calculated columns, or Power Query transformations.
Documentation should record both the original calculation and its intended Power BI implementation.
Include:
- Tableau calculated field name.
- Original formula.
- Business purpose.
- Input fields.
- Aggregation behavior.
- Filter dependencies.
- Power BI implementation approach.
- DAX formula or transformation reference.
- Validation results.
- Known differences.
- Developer or reviewer approval.
A calculation-mapping table can be particularly useful.
| Tableau Calculation | Power BI Approach | Validation Requirement |
| Total Sales | DAX measure using the approved sales aggregation | Compare totals |
| Year-over-Year Growth | DAX measure using appropriate date logic | Compare periods |
| Customer-Level LOD | DAX logic designed for the required granularity | Test filter context |
| Conditional Category | DAX or Power Query logic, depending on requirements | Compare classifications |
These are illustrative mappings, not universal one-to-one conversions.
Special attention should be given to Level of Detail (LOD) expressions such as FIXED, INCLUDE, and EXCLUDE. These may require different DAX patterns because Tableau and Power BI handle calculation context differently.
The documentation should explain why a particular implementation was selected and how it was tested.
5.6 Data Model and Relationship Documentation
The Power BI data model can differ substantially from the existing Tableau data structure.
Document the target model so that developers and future maintainers understand how tables and measures work together.
Include:
- Fact and dimension tables.
- Primary and foreign keys.
- Relationships and cardinality.
- Filter direction.
- Data granularity.
- Calculated columns.
- Measures.
- Date tables.
- Data types.
- Transformation rules.
- Model assumptions.
- Performance considerations.
Where appropriate, include a model diagram.
A well-documented semantic model can help reduce duplicated logic and support consistent KPI calculations across multiple reports.
5.7 Filters, Parameters, Actions, and Interactions
Dashboard functionality should not be documented only through screenshots.
A screenshot shows what the dashboard looks like, but it does not necessarily explain how it behaves when a user interacts with it.
Record:
- Tableau filters and their scope.
- Context-filter dependencies.
- Parameters and their permitted values.
- Sets and groups.
- Dashboard actions.
- Highlighting behavior.
- Navigation.
- Drill-down and drillthrough requirements.
- Tooltip behavior.
- User-selectable metrics.
- Expected interaction outcomes.
For each component, document the original behavior and the intended Power BI equivalent.
For example, a Tableau parameter used to switch between sales and profit may be implemented using a Power BI field parameter or another appropriate design. The choice should be recorded along with any functional differences.
5.8 Dashboard Design and Visualization Mapping
Visual consistency matters, but not every Tableau visualization has an exact equivalent in Power BI.
Documentation should identify which elements need to be preserved and which can be redesigned.
Record:
- Chart type.
- Purpose of the visualization.
- Dimensions and measures.
- Sorting and grouping.
- Labels and formatting.
- Conditional formatting.
- Color conventions.
- Tooltips.
- Layout requirements.
- Accessibility considerations.
- Custom visuals or extensions.
- Mobile or embedded requirements.
Screenshots of the original Tableau dashboard can provide a helpful visual reference. Pair them with notes explaining expected behavior and the business purpose of each major visual.
If a chart is being redesigned, document the reason so stakeholders understand why the Power BI version may look different.
5.9 Security, Permissions, and Row-Level Security
Security must be reviewed and implemented for the target environment. It should never be assumed that Tableau permissions automatically transfer to Power BI.
Document:
- User groups and roles.
- Report access requirements.
- Workspace and application permissions.
- Row-level security requirements.
- Data sensitivity classifications.
- Authentication dependencies.
- Data-source access.
- Approval responsibilities.
- Security test cases.
- Known access limitations.
For example, a regional manager may be permitted to see only the sales data for their region. The Power BI implementation should preserve this requirement through an appropriately designed and tested security model.
Do not place passwords, tokens, or other secrets directly in general-purpose migration documentation. Reference the approved secure credential-management process instead.
5.10 Data Refresh and Integration Requirements
A dashboard that displays accurate data during development can still fail after deployment if refreshes, gateways, or integrations are not configured correctly.
Document:
- Refresh frequency.
- Data freshness requirements.
- Source-system dependencies.
- Refresh schedules.
- Gateway requirements.
- Credentials and ownership.
- Refresh failure handling.
- Data latency expectations.
- Integration endpoints.
- API dependencies.
- Embedded reporting requirements.
- Monitoring and escalation procedures.
If a report depends on a daily data refresh, the documentation should define the expected completion window and explain how failures will be handled.
5.11 Testing and Data Validation Results
Testing documentation provides evidence that the migrated dashboard meets its requirements.
The testing plan should cover both technical correctness and business usability.
Document:
- Test case ID.
- Dashboard or report.
- Requirement being tested.
- Test inputs.
- Expected result.
- Actual result.
- Difference or discrepancy.
- Pass/fail status.
- Issue reference.
- Tester.
- Date.
- Approval.
Testing should cover data accuracy, calculation logic, filters, interactions, security, refresh behavior, and performance.
For critical KPIs, compare Tableau and Power BI results using consistent data, reporting periods, filters, and aggregation rules.
Where results differ, record whether the difference is an error, an intentional redesign, or an approved change in business logic.
5.12 Performance and Optimization Notes
Performance issues can arise when complex Tableau reporting logic is implemented inefficiently in Power BI.
The documentation should record performance expectations and optimization decisions.
Include:
- Report loading time.
- Data model size.
- Refresh duration.
- Expensive calculations.
- Query bottlenecks.
- Number of visuals.
- Data-source performance.
- Storage mode.
- Optimization changes.
- Results of performance testing.
For example, if a Power BI report initially loads slowly because of an inefficient model or complex DAX, record the issue, the corrective action, and the measured result.
This creates a useful baseline for future performance monitoring.
5.13 Deployment, Training, and User Acceptance
Migration documentation should continue through deployment and handover.
Include:
- Deployment environments.
- Release process.
- Workspace structure.
- Report ownership.
- Access approvals.
- User acceptance testing.
- Training requirements.
- User guides.
- Communication plans.
- Support contacts.
- Rollback or recovery procedures.
- Final sign-off.
Business users should confirm that the Power BI report supports their actual workflows, not just that it displays expected numbers.
Documenting user acceptance and sign-off helps establish accountability before the new reporting environment becomes the primary source of business insights.
5.14 Known Issues, Risks, and Migration Decisions
Not every migration issue can be resolved immediately. Some functionality may need redesign, and some differences may be accepted by the business.
Maintain a central record of:
- Known issues.
- Technical limitations.
- Unresolved dependencies.
- Calculation discrepancies.
- Design differences.
- Workarounds.
- Risks and mitigation plans.
- Decisions and their rationale.
- Responsible owners.
- Target resolution dates.
- Approval status.
A decision log is particularly useful when multiple teams work on the migration. It prevents the same questions from being revisited repeatedly and explains why particular technical choices were made.
6. Tableau to Power BI Migration Documentation Checklist
Use the following checklist to assess whether the essential documentation is ready.
Tableau to Power BI Migration Documentation Checklist
Use this checklist to ensure that all essential documentation is prepared throughout the migration process.
1. Planning
- Project scope and migration objectives
- Dashboard inventory and ownership
- Migration priorities and success criteria
2. Technical Assessment
- Data sources and dependencies
- Business logic and KPI definitions
- Tableau-to-DAX calculation mapping
- Power BI data model and relationships
- Filters, parameters, and dashboard interactions
3. Governance and Validation
- Security and access requirements
- Refresh and integration configuration
- Data and calculation testing results
- Performance testing and optimization notes
4. Deployment and Handover
- Known issues, risks, and decision log
- User acceptance testing and business sign-off
- Deployment, training, and support documentation
The checklist can be adapted to the project’s size and complexity. Smaller migrations may require concise documentation, while large enterprise migrations may need detailed technical specifications, formal approvals, and comprehensive testing records.
7. Recommended Documentation Templates and Formats
There is no need to store every migration detail in one large document. A set of connected documents is often easier to maintain.
| Document | What It Should Contain |
| Migration plan | Scope, timeline, milestones, responsibilities |
| Dashboard inventory | Reports, owners, complexity, migration status |
| Data-source register | Sources, dependencies, refresh requirements |
| Calculation mapping sheet | Tableau formulas, DAX approach, validation |
| Data model document | Tables, relationships, measures, architecture |
| Test and validation log | Test cases, results, discrepancies, approvals |
| Issue and decision log | Risks, issues, decisions, owners |
| Deployment and handover guide | Releases, permissions, training, support |
These can be maintained in spreadsheets, technical documents, architecture diagrams, project-management systems, or an approved documentation repository.
The important factor is not the file format. It is whether the information is accurate, accessible to the right people, and updated throughout the project.
8. Who Is Responsible for Maintaining Migration Documentation?
Documentation should have clear ownership. If every team assumes another team will maintain it, important details are likely to become outdated.
Migration documentation should remain useful after deployment, with updates recorded whenever data models, calculations, security settings, or reporting requirements change. Businesses planning Tableau to Power BI Migration in Dallas can use this approach to support ongoing maintenance, simplify troubleshooting, and make future analytics improvements easier to manage.
A practical division of responsibility looks like this:
- Project manager: Maintains scope, milestones, risks, issues, and overall migration status.
- Tableau specialist: Documents existing workbook behavior, calculations, filters, and dependencies.
- Power BI developer: Documents DAX logic, data models, report design, and implementation decisions.
- Data engineer: Maintains source mappings, transformations, pipelines, and refresh dependencies.
- Business owner: Confirms KPI definitions, business rules, expected results, and acceptance criteria.
- IT or security team: Reviews access requirements, governance, and security controls.
One person or team should also be responsible for ensuring that the documentation remains consistent and can be located easily.
9. Common Documentation Mistakes to Avoid
Documenting only the dashboard’s appearance
Screenshots are useful, but they do not explain calculations, data dependencies, or user interactions. Include both visual references and functional documentation.
Ignoring business definitions
A formula may be technically correct but still fail to represent the intended business metric. Record the approved KPI definition alongside its technical implementation.
Assuming calculations convert directly
Tableau and Power BI have different calculation models. Document the implementation approach and validation results rather than assuming similar-looking formulas produce identical outcomes.
Leaving out security and refresh configuration
Reports may work during development but fail in production because permissions, gateways, or refresh schedules have not been documented.
Waiting until the end of the project
Documentation created only after migration often misses important decisions and assumptions. Start during discovery and update it throughout development and testing.
Failing to record intentional differences
Sometimes a Power BI report is deliberately redesigned. Record what changed, why it changed, and who approved the difference.
10. Best Practices for Maintaining Documentation After Migration
Migration documentation should remain useful after the project is completed.
Use version control. Track important changes to calculations, data models, report definitions, and technical decisions.
Maintain a central repository. Store documentation in an approved location with appropriate access controls and clear ownership.
Connect documents to reporting assets. Use consistent names or identifiers so that a dashboard can be traced to its data sources, calculations, and tests.
Update documentation during changes. When a KPI, measure, refresh process, or security rule changes, update the relevant records as part of the development process.
Review business-critical reports periodically. Confirm that their owners, definitions, dependencies, and access requirements remain accurate.
Automate where practical. Metadata extraction, inventory updates, and parts of testing may be automated, reducing repetitive documentation work. Generated information should still be reviewed for accuracy.
These practices help prevent the new Power BI environment from becoming as difficult to understand as an undocumented legacy environment.
11. Frequently Asked Questions
Is documentation necessary for every Tableau to Power BI migration?
Yes, some level of documentation is advisable for every migration. The amount of detail should depend on the number of reports, technical complexity, business criticality, and governance requirements.
What is the most important document to prepare before migration?
A dashboard and workbook inventory is an excellent starting point. It establishes the scope of the project and helps teams identify ownership, data dependencies, complexity, and migration priorities. KPI definitions and data-source mappings should follow early in the assessment.
Should Tableau calculations be documented individually?
Business-critical and complex calculations should be documented individually. This is especially important for LOD expressions, financial measures, and calculations that influence important business decisions. Simple calculations may be documented through a lighter-weight inventory where appropriate.
Who should own migration documentation?
Documentation responsibility should be shared among project managers, Tableau specialists, Power BI developers, data engineers, and business owners. A designated project or governance lead should ensure that the documentation remains complete and consistent.
Can migration documentation be automated?
Parts of the process can be automated, including metadata extraction, inventory generation, dependency analysis, and some validation activities. However, business definitions, design decisions, and complex calculation logic still require review by knowledgeable people.
How often should documentation be updated?
Documentation should be updated whenever meaningful changes occur to reports, calculations, data sources, security, or deployment processes. Business-critical documentation should also be reviewed periodically to confirm that it remains accurate.
12. Conclusion
Effective Tableau to Power BI migration requires more than recreating dashboards. Organizations need clear documentation of reporting assets, data dependencies, business rules, calculations, data models, security, testing, and deployment decisions to preserve business knowledge and maintain confidence in the new environment.
A structured documentation process makes migration easier to manage, helps teams identify problems earlier, and creates a reliable foundation for ongoing analytics development. It also gives organizations an opportunity to remove redundant reports, standardize KPIs, and build a more maintainable Power BI environment.
CRG Solutions can help enterprises approach analytics migration with a focus on business requirements, technical implementation, validation, and long-term reporting value.