Finance & Sales Analytics: Unlock your Data Potential
21st November | Mumbai
4 Steps For Finance Departments To Drive Business Intelligence
Complimentary Breakfast Event on Nomination Acceptance
Are you engaged in supporting your Sales or Finance leadership with insightful reporting and analytics? Would you like to enhance the value of the insights you deliver with Visual Interactive Analytics they will love and is easy to use? Would you like to become a Data-Hero within your organization?
Then, you should get yourself nominated for this Hands-on Workshop via your CFO or Head of Sales. In this 3 hours Learning Session, you will learn to create Visual Analytics with Tableau. And, then wow your leaders by doing an analysis post the workshop.
4 Fundamentals of Sales Analytics Success
How to Participate in the Event?
We invite CFO or Head of Sales nominated executive, to join us in this breakfast event by filling out the registration form.
Register Now
Finance Analytics
Finance moves fast. It’s time to move beyond the spreadsheet, to a flexible business intelligence solution as sophisticated as your data. Discover what happens to your bottom-line when you can see and understand your financial data. Start performing superior financial analysis that looks beyond numbers on a spreadsheet to drive real impact throughout the organisation.
Learn how Tableau can help you overcome some of the main challenges that finance departments faces such as cutting costs, financial planning, and helping business leaders make real- time data-driven decisions.
Learn how Tableau can help you overcome some of the main challenges that finance departments faces such as cutting costs, financial planning, and helping business leaders make real- time data-driven decisions.
We will share and discuss our favourite financial dashboards including:
- Purchasing: Dig deeper into your purchasing data
- Cost Control: See how visual analytics can reduce costs
- Accounts Receivable: Analyse your data regionally or by account
- Executive Dashboard: Your groups financial health in one dashboard
- Financial Planning: Deliver previously unknown insights to business leaders
Sales Analytics
Tableau empowers sales teams to accelerate analysis and make a greater impact with their business data. From tracking quotas to pipeline, Tableau helps sales teams transcend report building and perform trustworthy analysis from a single source of truth that decision makers can rely on. With Tableau, the entire sales organization is equipped with shareable, actionable insights that help illuminate what’s working and what isn’t, where the opportunities are, and what needs to be prioritized to scale the team’s success.
We will share and discuss our favourite financial dashboards including:
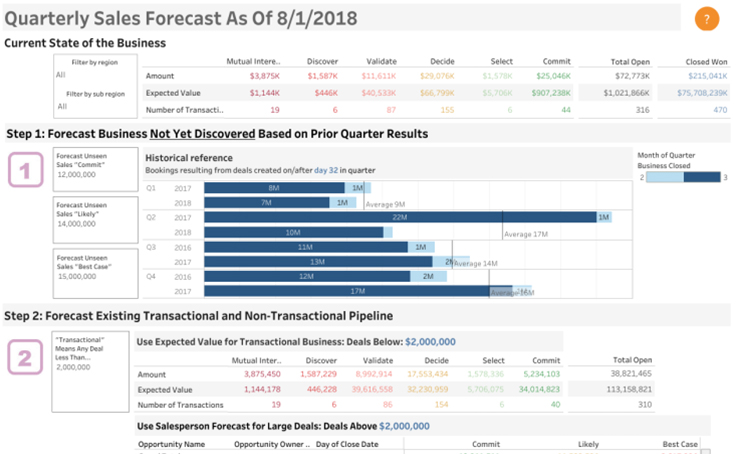
- Forecasting: Forecast existing pipeline accurately
- Pipeline: Understand your pipeline, prioritize and act on important deals
- Sales Growth: Set attainable sales goals, understand sales trends
- Territory Assignment: Minimize account disruption, assign clear balanced territories
- Account Management: Create a comprehensive Account Dashboard
Finance Analytics Dashboard Examples

Finance Dashboard
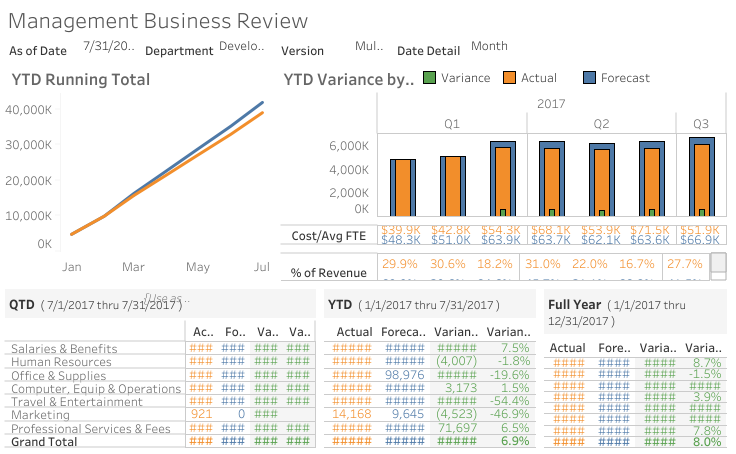
Management Business Review
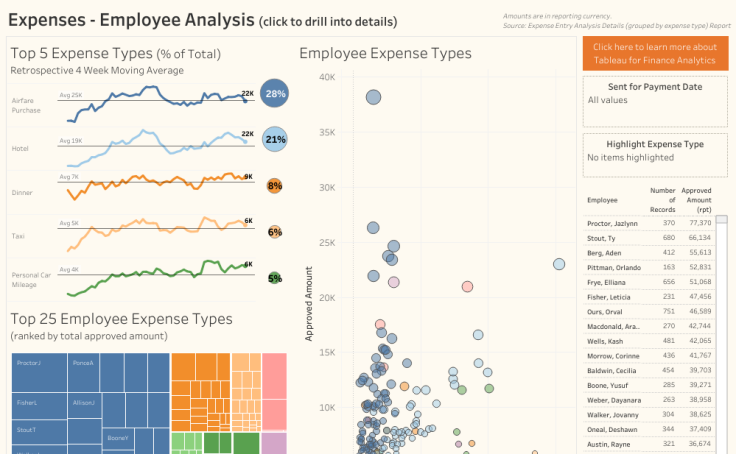
Employee Analysis – Expenses
Sales Analytics Dashboard Examples
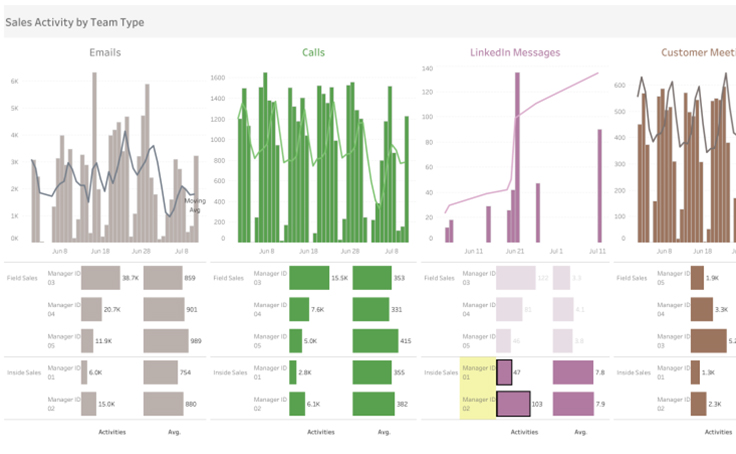
Sales Activity
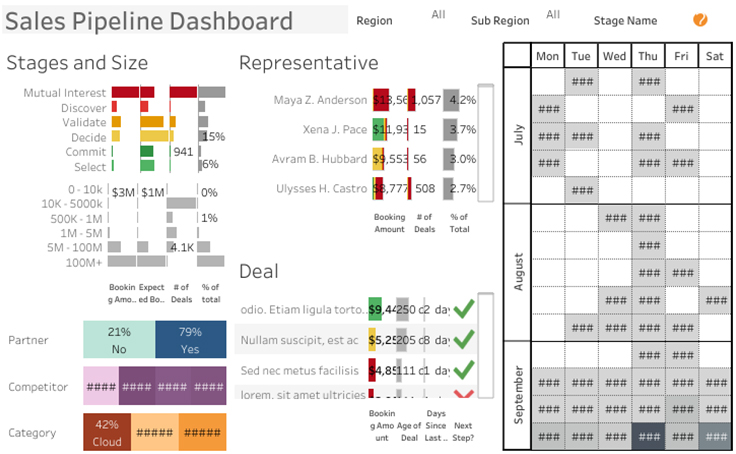
Sales Pipeline