
Understanding the US Elections Prediction Heatmap through Data Analytics
By Paresh Gudhka, Lead Business Analyst, CRG Solutions As the 2024 U.S. Presidential election approaches, the political landscape is characterized by intense competition, with pundits and polls indicating a race that is too close to call. The visualization of this...
How to Migrate Your Data Pipelines to Support Tableau Cloud
Today, most of the businesses are moving to cloud based environments, and one of the major reasons for this is the COVID19 shut down. When the whole world shut down and businesses had to find alternatives to make it work,...
How to Unlock Hidden Insights with Alteryx Auto Insights
Organisations are constantly looking for new ways to extract value out of gigantic piles of data that are in queue and this has become the need of the hour. The future is all about unlocking the hidden insights within those...
Best Practices for Implementing a Secure and Efficient AI-Ready Data...
As the world is increasingly moving towards artificial intelligence for everything from deriving insights to innovation, having a safe and effective AI-ready data architecture has become a thing of paramount importance. AI hugely depends on data but without a scalable,...How data lakehouses will shape tomorrow’s enterprises with advanced analytics...
Data Lakehouse came to existence as data warehouses and data lakes were becoming less capable of meeting today's sophisticated demands. As businesses are handling ever increasing volumes of data, the traditional data architectures were becoming incapable of handling today's requirements....
How Enterprises Should Prepare for AI’s Impact on Risk Management and...
By now we all will agree that artificial intelligence is no longer a futuristic concept, it is here and we are part of this revolution and as we see it's transforming industries at an unparalleled pace. While it is brings...
Tableau usage enhancements with Date functions
By Sreekesh Eyyapadi, Technical Lead, CRG Solutions There are many date functions in Tableau. Some manipulate dates, some convert data to dates, some identify if data is a date. This article will run through the main date functions and give...
Enhancing Business Insights for an Italian food retailer with Advanced...
Quick Summary CRG Solutions' development of a sophisticated analytics dashboard for the retail store transformed the company's approach to managing its extensive restaurant network. This case study underscores the critical role of advanced data analytics in the food service industry,...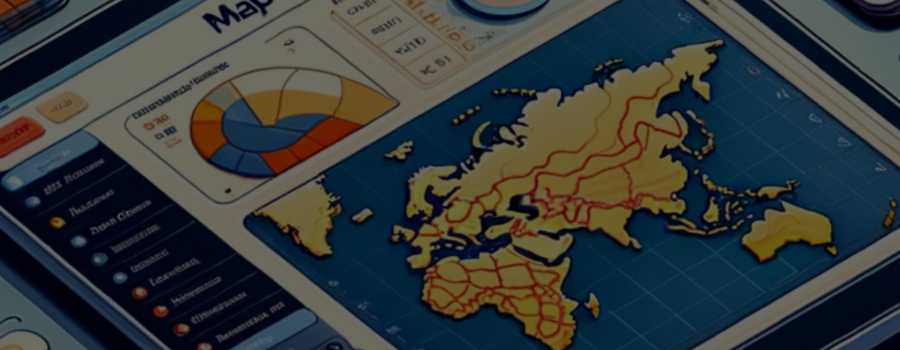
Tableau created meaningful visualizations to gain insights and yielded...
Quick Summary The Revenue Department's adoption of data analysis using Tableau has significantly improved their ability to manage land records and property registration. The insights gained through visualizations have enhanced decision-making, streamlined processes, and improved transparency and accountability. By leveraging...
Tableau dashboard facilitated direct communication with applicants under Nagar...
Quick Summary Data analysis has greatly benefited the government in tracking the status of applications received through the Nagar Darshan portal. The analysis has enabled effective processing of applications, identification of pending applications, and understanding the reasons behind the delays....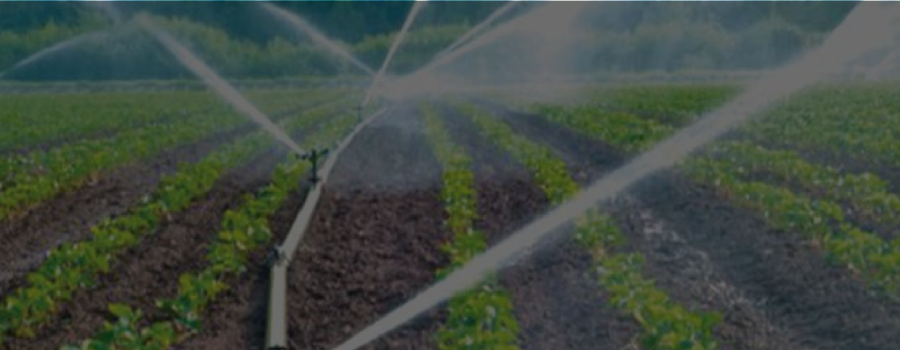
Tableau provided valuable insights in implementing Micro Irrigation scheme
Quick Summary Data analysis provided valuable insights into the implementation of the Micro Irrigation scheme by MICADA. The assessment of physical and financial achievements helped track progress towards targets, enabling necessary follow-ups and actions. Monitoring the status of applications at...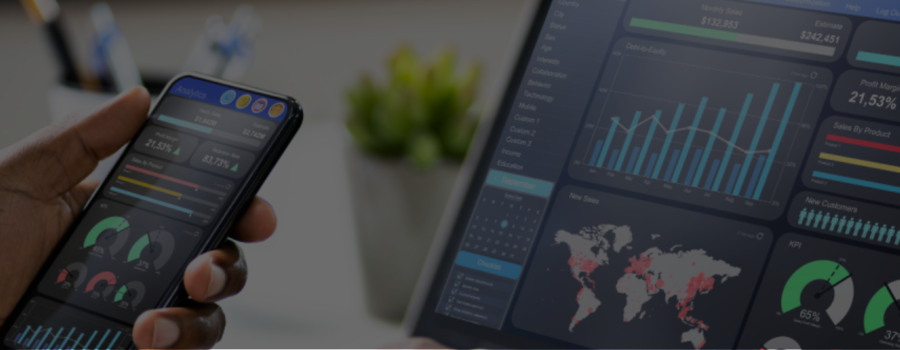
Analytics aids successful implementation and impact of MMAPUY program in the...
Quick Summary MMAPUY has emerged as a successful initiative in the State, aiming to uplift the poorest families and provide them with sustainable economic opportunities. By effectively targeting and supporting these families, the program has made significant progress in poverty...
Data Visualization tool implemented to analyze distribution of Jal Jeevan...
Quick Summary Through effective data analysis and visualization, the State Government has been able to track the progress of the JJM scheme and take necessary actions to achieve the goal of providing safe drinking water to all rural households. By...
Tableau Data Analytics tool facilitated Mhara Gaon Jagmag Gaon (MGJG)...
Quick Summary Data analysis played a crucial role in assessing the implementation status of the MGJG scheme in State of North India. By analyzing village and feeder coverage, household connection percentages, and division-wise details, the government can make informed decisions...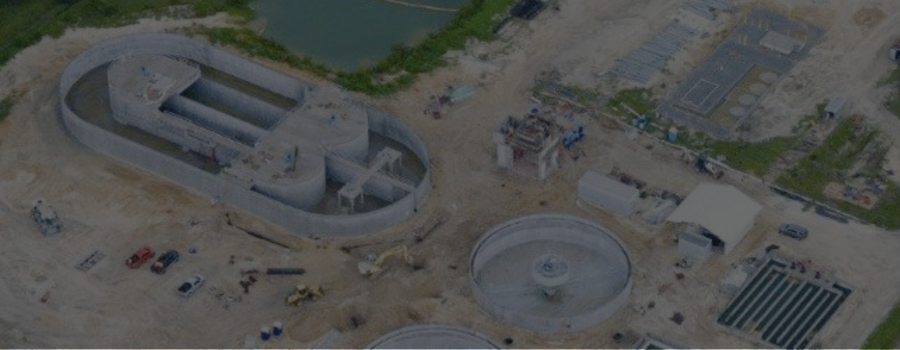
Data Analytics Tool Tableau implemented to maintain demand and supply in...
Quick Summary Through the utilization of data analysis tools, the Irrigation Department of the State Government successfully tracked the demand versus supply of water and identified areas with supply deficits. This approach has enhanced the department's ability to monitor and...