By Paresh Gudhka, Lead Business Analyst, CRG Solutions
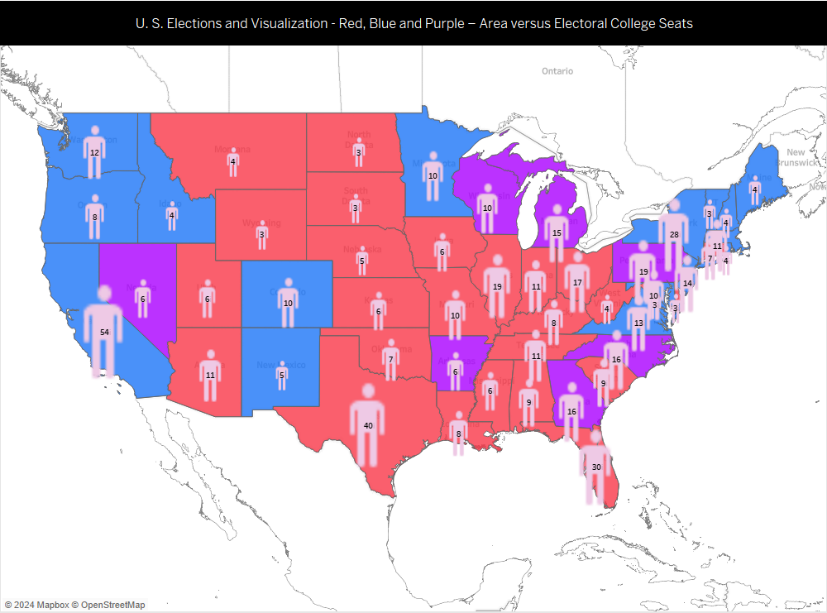
As the 2024 U.S. Presidential election approaches, the political landscape is characterized by intense competition, with pundits and polls indicating a race that is too close to call. The visualization of this electoral contest often takes the form of a heatmap, where states are color-coded—red for Republican, blue for Democrat, and purple for battleground states. This blog will explore how data analytics can enhance our understanding of these predictions and the implications of state size versus electoral college votes.
The Electoral College System
The U.S. electoral system is unique in that it does not rely solely on popular votes to determine the winner of Presidential elections. Instead, it uses the **Electoral College**, where each state is allocated a number of votes based on its population. This means that larger states like California and Texas carry more weight in the election compared to less populated states such as Wyoming or Montana.
Key Points:
- Electoral Votes: States with larger populations have more electoral votes.
- State Size vs. Population Density: Larger states by area may not necessarily translate into a higher number of electoral votes if they have low population densities.
- Battleground States: These are crucial in determining the outcome as they can swing either way.
Data Visualization: The Heatmap
The heatmap serves as a powerful tool to visualize electoral predictions. However, it can be misleading if one only considers state size without factoring in population density and electoral votes. For instance:
- Large Area States: States like Montana and South Dakota occupy significant space on the map but have low population densities and fewer electoral votes.
- High Population States: Conversely, states like New Jersey and Massachusetts are small in size but dense in population, yielding more electoral votes.
This discrepancy highlights the importance of not just viewing the map based on area but understanding the underlying data regarding population distribution and voting patterns.
Predictive Models in Data Analytics
Data analytics plays a crucial role in predicting election outcomes. Various models utilize historical data, polling information, and demographic factors to forecast results. For example:
- Markov Chain Monte Carlo (MCMC): This statistical method allows analysts to simulate numerous potential election outcomes based on varying factors such as polling errors or shifts in voter sentiment.
- Random Forest Models: These models analyze socio-economic indicators to predict voting behavior at the county level, revealing insights into how different demographics may lean politically
Implications of Data Analytics on Election Predictions
The integration of data analytics into election forecasting provides several advantages:
- Enhanced Accuracy: By using sophisticated models that account for various uncertainties and demographic factors, predictions can become more reliable.
- Real-Time Updates: As new polling data emerges, models can be adjusted to reflect changing dynamics in voter sentiment.
- Visual Insights: Heatmaps and other visual tools help convey complex data in an accessible format, allowing voters and analysts alike to grasp the current electoral landscape quickly.

Credits for map:
Priyal Dighe & Harsh Thakur – CRG Solutions.
Conclusion : As we approach the 2024 U.S. Presidential election, understanding the interplay between state size, population density, and electoral college votes through data analytics becomes paramount. The use of heatmaps not only illustrates potential outcomes but also emphasizes the importance of analyzing underlying data trends that shape these predictions. By leveraging advanced statistical methods and real-time data updates, analysts can provide clearer insights into this closely contested race, ultimately guiding voters in making informed decisions.
In summary, while the heatmap provides a snapshot of potential electoral outcomes, it is essential to delve deeper into the data analytics behind these predictions to fully appreciate the complexities of U.S. elections.


Leave a Comments
You must be logged in to post a comment.