Quick Summary
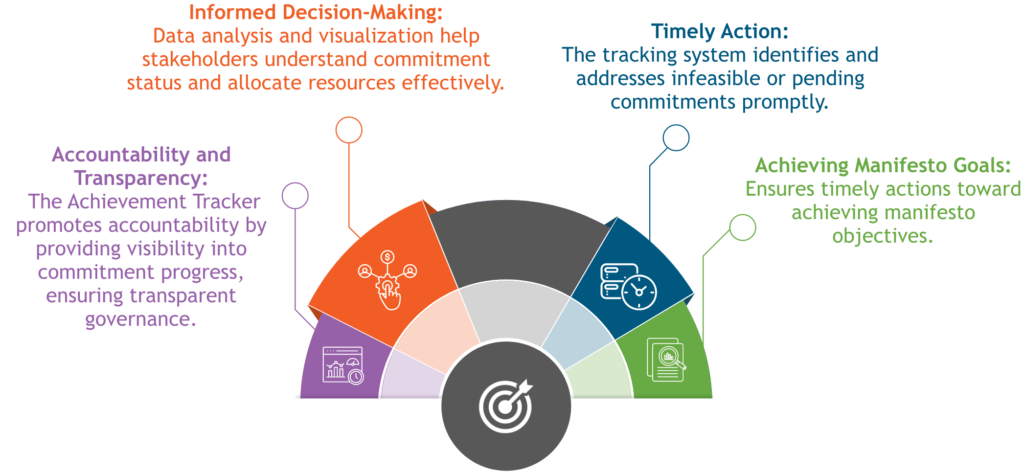
The Achievements Tracker enabled the state government to effectively monitor manifesto commitments. Utilizing data analysis and visualization, stakeholders could track progress, make informed decisions, and take timely actions. This case study highlights the importance of data-driven tracking systems in promoting accountability, transparency, and efficient governance.

About the Customer
A north Indian state, after forming a government, had to fulfill and implement promises that were made in their manifesto. The manifesto was released, outlining commitments across various sectors. The manifesto includes many initiatives and policies, including measures for agriculture, education, healthcare, infrastructure, and employment generation. The manifesto also places a strong emphasis on promoting the state’s cultural heritage and heritage sites, aiming to foster an environment of inclusivity and welfare for all sections of society.
To ensure the fulfillment of these commitments and to track the status of commitments made in the manifesto, the state is required to identify the number of beneficiaries it has reached and determine the unit and nodal department responsible for each commitment. This was important to ensure implementation and growth.

Problem Statement
To provide insights into the progress of each commitment outlined in the manifesto was a big challenge. The specific goals included determining the commissioning status, identifying the number of beneficiaries reached, and associating each commitment with its respective unit and nodal department. Some of the challenges were:
- Data Collection: Gathering accurate and up-to-date data from the government’s database (Maria DB) presented a challenge in terms of ensuring information reliability.
- Commitment Categorization: Properly categorizing commitments as commissioned, in-progress, pending, or infeasible necessitated a thorough understanding of each commitment’s status and progress.
- Data Analysis and Visualization: Transforming raw data into meaningful insights through data analysis and visualization required expertise in utilizing Tableau effectively.

Solution
To ensure the fulfillment of these commitments, an achievement tracker was developed to monitor the progress and status of each commitment in order to ensure its fulfillment. The following steps were recommended and implemented by CRG Solutions:
- Data Extraction: To create a dataset for analysis, we extracted relevant data from the government’s database.
- Data Cleaning and Validation: To ensure accuracy and reliability in tracking commitments, we cleansed and validated the extracted data.
- Commitment Status Classification: Commitments were categorized based on their commissioning status, distinguishing between commissioned, in-progress, pending, and infeasible commitments.
- Tableau was used to visualize the commitment data and derive insights, enabling stakeholders to effectively monitor the progress of commitments.
The analysis of the Achievements Tracker data yielded the following results:
- The commissioning of only 11.5% of commitments shows progress towards fulfillment.
- Around 20% of commitments are currently in progress, indicating ongoing efforts to meet them.
- Infeasible and pending commitments were identified, allowing for necessary actions and decision-making at the departmental and unit levels.
- The data provided insights into the number of beneficiaries reached and the nature of each commitment, such as the implementation of new schemes or the enhancement of existing ones.

Business Benefits


Leave a Comments
You must be logged in to post a comment.